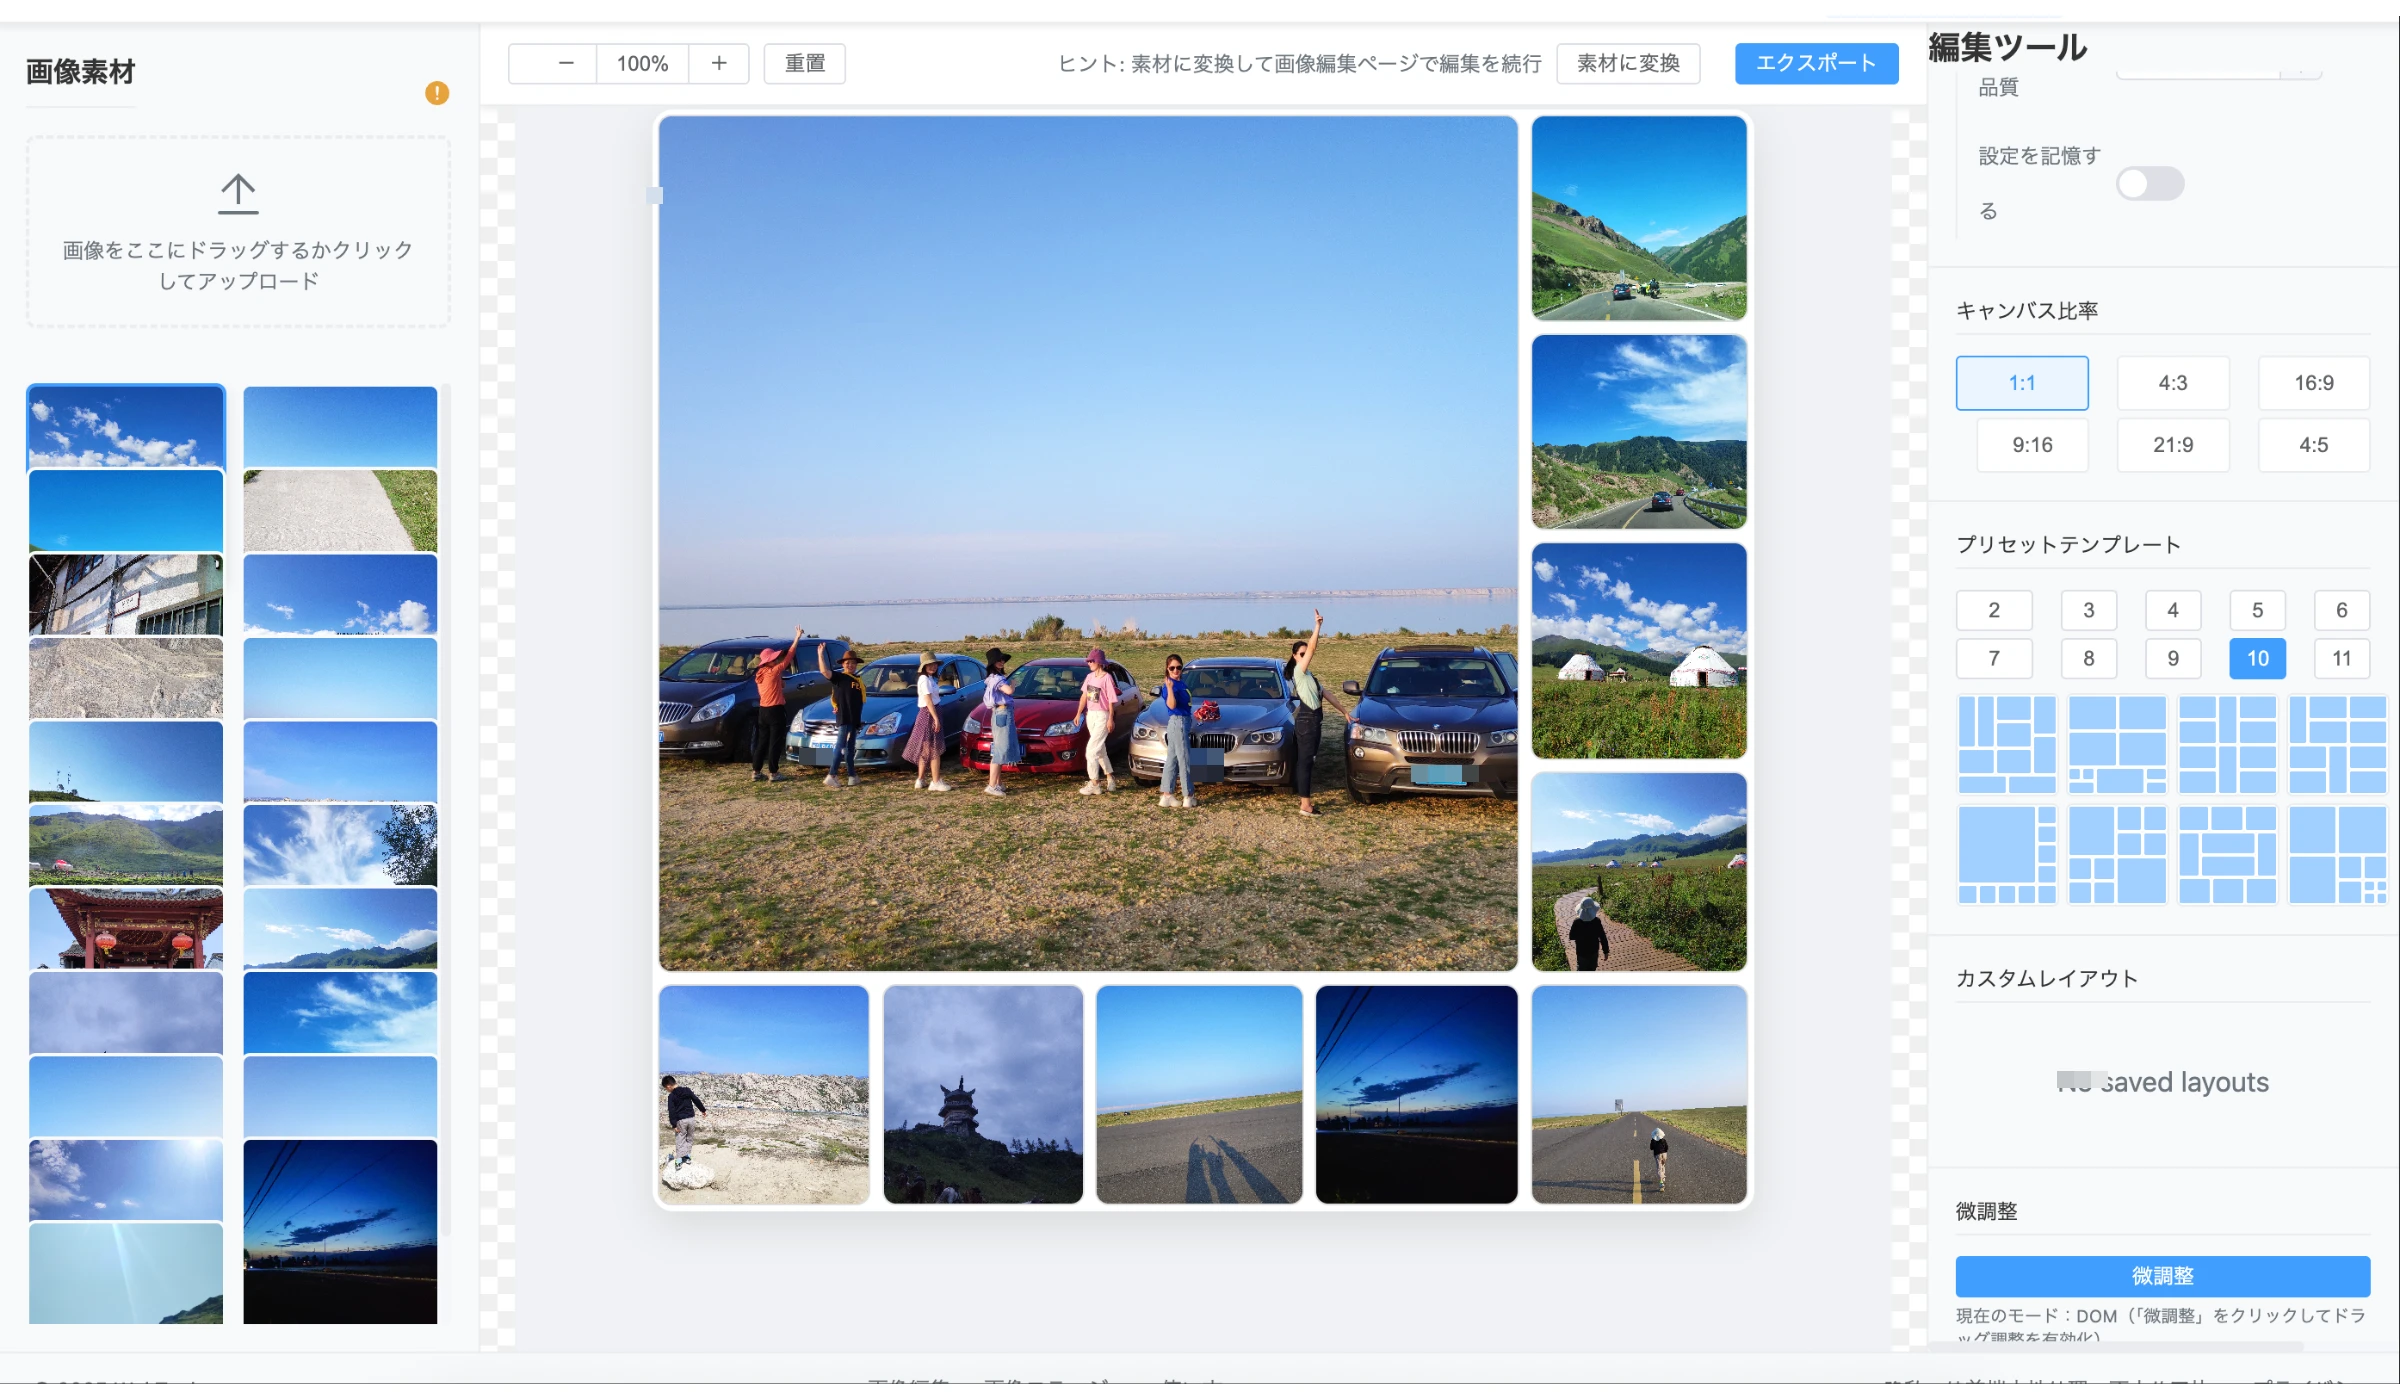
Cursor Practice Project-17-Rapid Development of Social Media Image Tools with Cursor: A Comprehensive Guide from Concept to Launch (Part 5) — Analyzing Website Traffic with Google Analytics
Project Overview
Launching is just the beginning: How many visitors come, where do they come from, how long do they stay, and which pages are most popular? This guide walks you through integrating Google Analytics to drive data-driven iterations.
Estimated time: ~30 minutes (real-time data becomes available immediately after setup)
Cursor usage count: ≈ 1
Key outcomes: Real-time active users, popular pages, traffic sources, geographic and device data, and basic conversion events at a glance.
Demo
Live website: pixtoolkits.com

Prerequisites
- Cursor
- Version: 1.3.9
- Cursor rules: https://cursorpractice.com/zh/cursor-tutorials/prompts/system-prompts
- Agent: claude-4-sonnet-thinking, GTP-5
- Project rules: ./cursorpractice-06-10xUse.md
- Optional: Gemini CLI
- Install:
npm install -g @gemini-cli/gemini - Usage:
gemini --help
- Install:
- A registered Google account
Step-by-Step Guide
- Navigate to Google Analytics, click "Settings" > "Create" > "Property"

- Enter your domain name as the property name, then click "Next"

- Select "Electronics & Web" and "Small Business (1-10 employees)"

- Choose business objectives based on your needs

- Select "Web" as the platform

- Enter your domain under "Website URL," then click "Create & continue"

- Wait for the tracking code (Measurement ID / gtag.js) to generate, then copy the provided snippet

- Add the snippet to your website's
<head>section manually or via Cursor, then deploy

- After deployment, check the "Real-time" report in Google Analytics to confirm data collection

Tips:
- If real-time data doesn't appear, verify the Measurement ID, deployment status, and ensure no browser extensions/privacy settings are blocking tracking. Data may take 1-5 minutes to display.
- Place the tracking code in the global template's
<head>to ensure all pages are tracked.
Series
- Cursor Practice Project-13-Rapid Development of Social Media Image Tools with Cursor: A Comprehensive Guide from Concept to Launch (Part 1)
- Cursor Practice Project-14-Rapid Development of Social Media Image Tools with Cursor: A Comprehensive Guide from Concept to Launch (Part 2)-Basic Image Processing and Clipboard Handling
- Cursor Practice Project-15-Rapid Development of Social Media Image Tools with Cursor: A Comprehensive Guide from Concept to Launch (Part 3)-Photo Wall and Image Stitching
- Cursor Practice Project-16-Rapid Development of Social Media Image Tools with Cursor: A Comprehensive Guide from Concept to Launch (Part 4) — Domain Purchase + GitHub + Vercel + Cloudflare → Website Deployment
- Cursor Practice Project-17-Rapid Development of Social Media Image Tools with Cursor: A Comprehensive Guide from Concept to Launch (Part 5) — Analyzing Website Traffic with Google Analytics (Current Article)